Craft CMS 5 plugin
How hot can your site run before it melts?
Heat measures what a request actually costs your site — CPU, database, memory, and the time it spends blocked on somebody else’s server — then works out what happens when there are ten thousand of them.
Which resource runs out first. At how many visitors. And what to change — including when the obvious fix is the wrong one.
Free Lite edition · Craft CMS 5.3+ · PHP 8.2+ · no runtime dependencies

“Can it handle the launch?”
There are two usual answers, and neither one is any use.
The load test
It hits the site until something breaks and reports the number it broke at. It is real, and it tells you almost nothing you can act on: you learn that 270 concurrent requests was too many — not which resource ran out, not what to change, and not what the number becomes once you change it.
Worse, the honest way to run one is from another machine entirely, which is the thing nobody has set up at the moment they need the answer.
The spreadsheet
Cores, workers, an assumed page weight, some multiplication. It is actionable, and it is fiction — because it has never met your templates, your query count, or the fact that your homepage does forty-one things before it renders.
Every number in it is a number somebody guessed, presented in the same voice as the ones that were measured.
Heat does the half of each that works. It measures what a request costs on the machine you actually run, then does the arithmetic that turns that into a wall — and tells you which wall, and what is behind it.
Step one
Measure, don’t assume
A few dozen requests, one at a time, from inside your own site. It is not a load test — and that is the design, not a shortcut.
$ craft heat/measure

  · Pricing a bare Craft request
  · Measuring pages Craft has to render
  · Measuring pages as a visitor gets them
  · Measuring the same pages signed in
  · Timing an entry save
  · Timing a queue job

Measured
  scenario                     wall       cpu  database   blocked  queries  memory
  Cached visitor page          9.4ms        —         —         —        —       —
  Rendered visitor page       218ms      74ms      91ms     6.2ms       84    47MB
  Logged-in visitor           344ms     119ms     162ms      11ms      131    56MB
  Editor saving an entry      627ms     198ms     318ms     8.4ms      240    94MB
  Queue job                   1.42s     402ms     975ms     6.1ms      196    81MB

  A bare Craft request costs 24ms before your templates do anything.
  71 requests in 19.4s.
Real CPU, not leftovers
CPU comes from getrusage(), so working and waiting are actually told apart. Wall time minus database time would charge a request blocked on a payment gateway to the CPU — and the model would then confidently recommend cores that would not help by a single request per second.
It doesn’t inflate what it measures
Yii’s query profiler renders the raw SQL of every statement to label it — real work, charged to the request being measured. So timing and query counts come from separate passes. A tool whose measurement changes the answer is the exact failure this exists to avoid.
A 200 with no metrics is the good news
If a page comes back without Heat’s instrumentation header, PHP never ran: a proxy, a static cache or a CDN edge answered and your origin was never involved. That request costs no worker, no connection and no query — and Heat models it that way.
In The Control Panel
Real screens from a Craft 5 install — the projection Heat produced for this site, and the runs behind it.
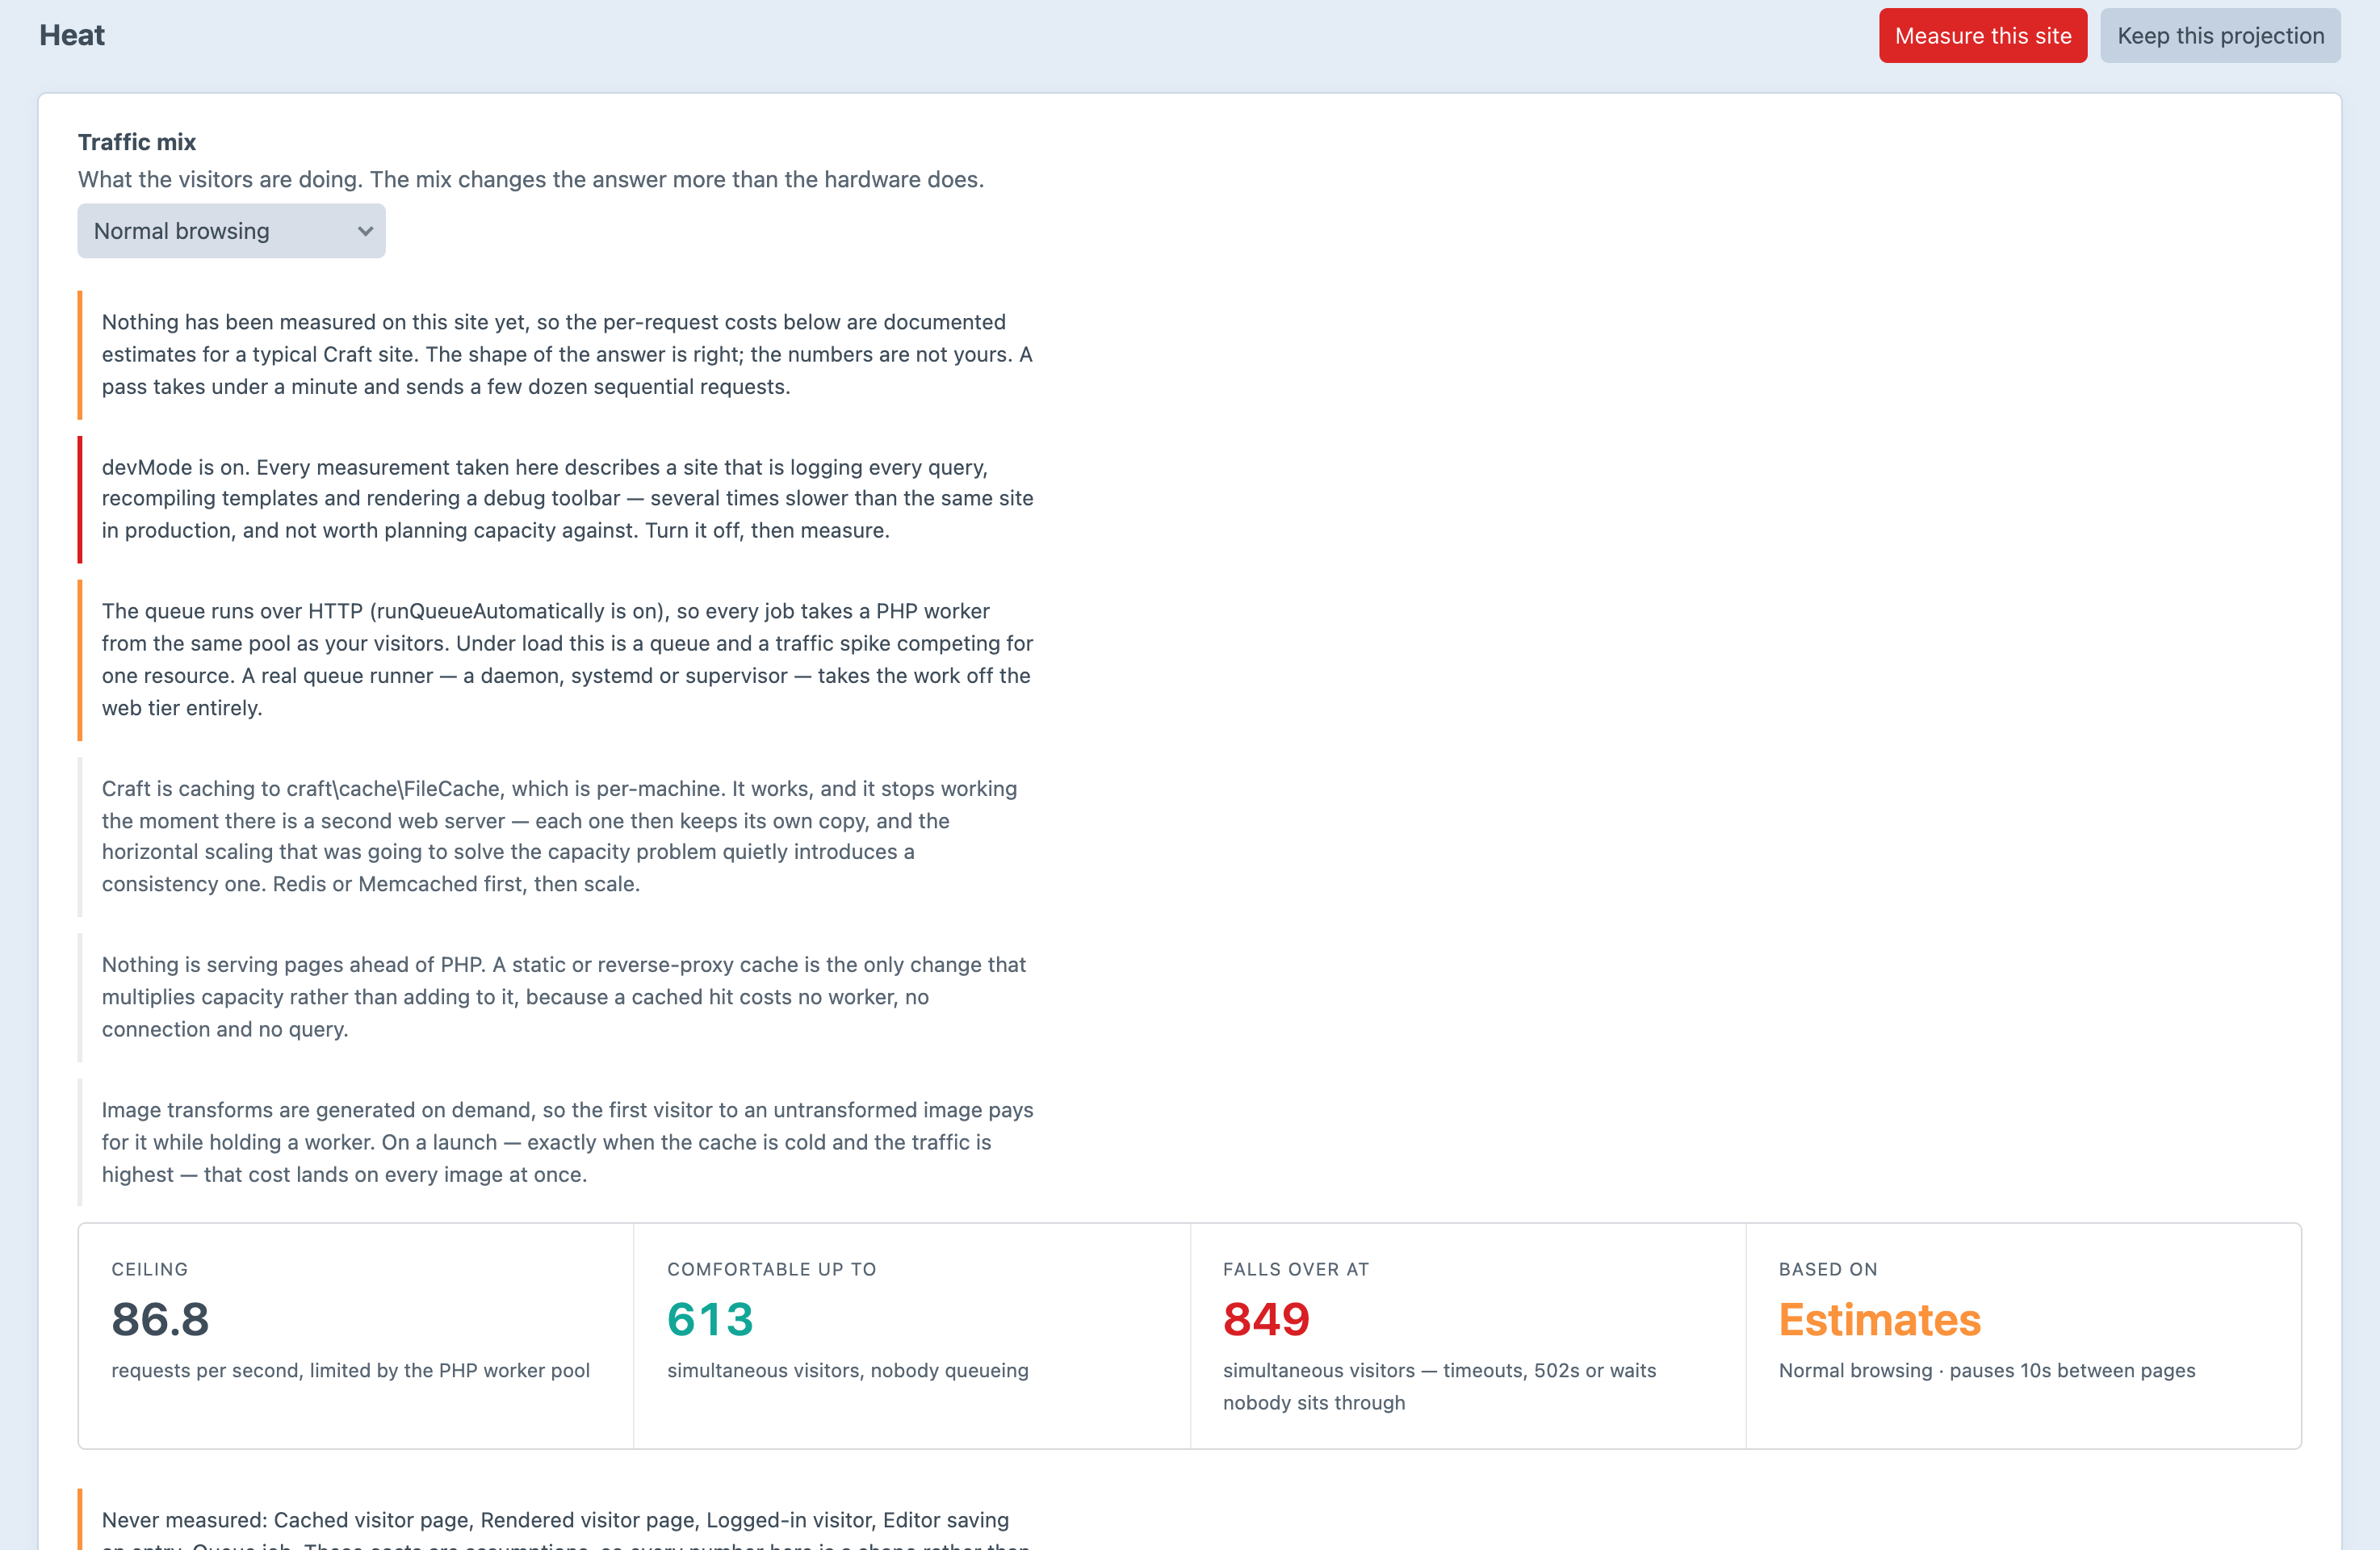
The model, run against what this install actually measured.
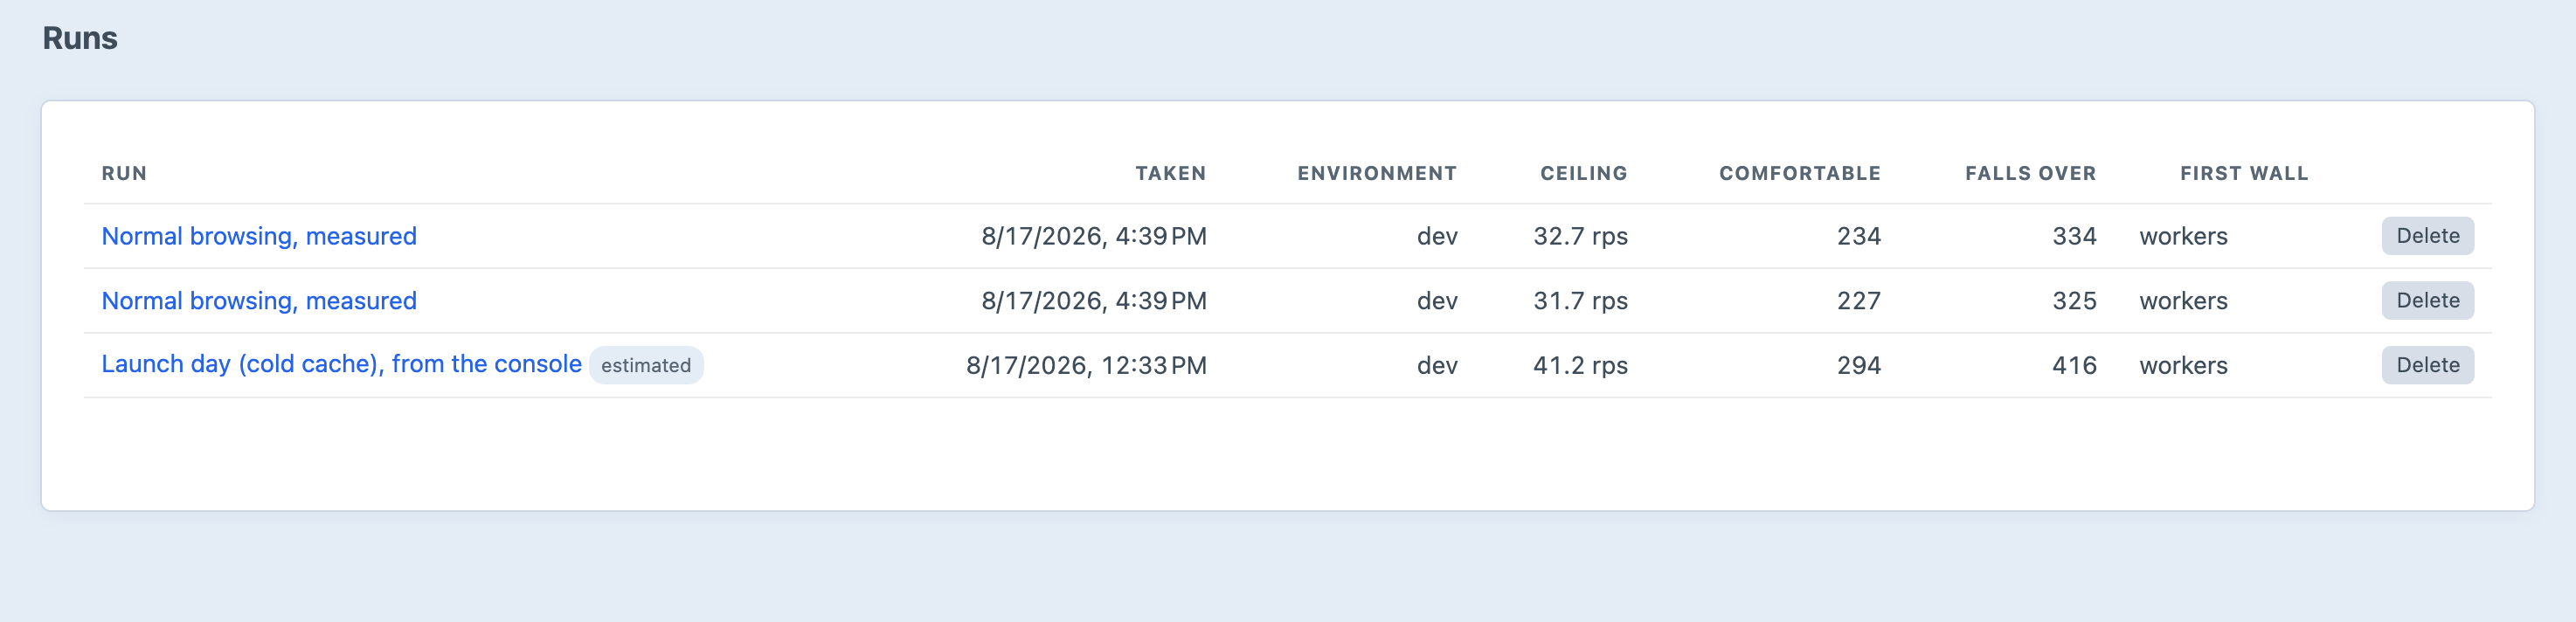
Every run, so a projection can be compared with the one before it.
Screenshots from a live install, not mockups.
Step two
Then find the wall
Not a percentage nobody acts on. The load at which requests start queueing, and the load at which visitors start getting 502s.
Ceiling
130
requests per second, limited by the PHP worker pool
Comfortable up to
920
simultaneous visitors, nobody queueing
Falls over at
1,264
timeouts, 502s, or waits nobody sits through
Based on
Measured
normal browsing · pauses 10s between pages
| Visitors | Requests/s | Load | Typical | Slowest 5% | In flight | |
|---|---|---|---|---|---|---|
| 100 | 9.9 | 83ms | 156ms | 1.0 | Comfortable | |
| 500 | 49.5 | 83ms | 157ms | 4.8 | Comfortable | |
| 920 | 91.0 | 87ms | 175ms | 9.3 | Comfortable | |
| 1,000 | 98.9 | 89ms | 184ms | 10.6 | Queueing | |
| 1,092 | 108.4 | 95ms | 210ms | 12.1 | Queueing | |
| 1,264 | 123.7 | 319ms | 1.02s | 39.0 | Falling over | |
| 2,000 | 130.0 | 3.75s | 16.03s | 700 | Falling over | |
| 5,000 | 130.1 | 19.72s | 85.14s | 3,699 | Falling over |
Past the ceiling, throughput stops rising and only the wait grows. Around 1,264 visitors the queue on the listen socket passes the backlog, and the site stops returning slow pages and starts returning 502s.
Visitors, not requests
Ten thousand people reading a page for ten seconds each generate about a thousand requests a second, not ten thousand. Nearly every capacity argument that goes wrong goes wrong exactly there, so think time is an input you can see and argue with — not a constant buried in the maths.
Sites grind, they don’t explode
Heat models a closed population: when the site gets slow, people wait, so they click less often. That feedback is what makes the numbers past the ceiling finite — and what makes them match what actually happens. An open model’s answer past saturation is the word “infinity”.
What runs out, and in what order
The ceiling is arithmetic, not a model. If a request occupies one of m things for D seconds, nothing completes more than m/D requests a second — whatever the traffic looks like.
| Resource | Available | Per request | Ceiling | Runs out when |
|---|---|---|---|---|
| 1. PHP workers | 12 | 92ms | 130 rps | dynamic traffic exceeds the pool |
| 2. CPU | 8 cores | 53ms | 151 rps | the pool is bigger than the cores can feed |
| 3. Database | ~10 at once | 39ms | 255 rps | queries queue behind each other |
| 4. Database connections | 151 | 92ms | 1,638 rps | the pool outgrows the limit |
Connections are not throughput
max_connections is how many clients may be connected. It is usually in the hundreds, it is what everybody quotes, and it is not a throughput limit. Four hundred connections on four cores does not run four hundred queries — it runs four and queues three hundred and ninety-six.
Which is why “we raised max_connections and it got slower” is a thing people say. Heat keeps the two as separate numbers, and says which one is short.
Memory isn’t a queue
So it isn’t modelled as one. It caps the worker count instead: a pool configured beyond what RAM supports does not queue — it forks until the OOM killer picks something, frequently the database.
Heat models the pool the machine can actually run, says so, and refuses to recommend making it bigger.
Step three
And what to actually do
Naming a bottleneck is the easy half. “You are worker-bound” is true of nearly every Craft site under load and tells nobody what to change on Monday.
It quotes your own numbers
There is RAM for 154 workers and only 12 are configured. Raising pm.max_children to 154 moves this ceiling to about 1,670 requests per second — but check the next wall before you do: CPU gives out at 151 requests per second, so the real gain stops there.
It says when not to act
Do not raise the pool. It is already configured for 200 workers, and at 256 MB of peak memory each, the 4 GB of RAM available supports 16. Under real load the pool will fork past what the box has and the OOM killer will pick something to kill — frequently the database, which turns a slow site into a broken one.
It tells multiplying apart from adding
Only 25% of the modelled traffic is served without touching PHP. Requests answered by a reverse proxy, a static cache or a CDN edge never take a worker — pushing the hit rate to 80% would put this ceiling at roughly 154 requests per second without changing a line of the site. This is the only fix on the list that multiplies capacity; everything else adds to it.
It finds the cost nobody looks for
Roughly 93% of every request’s worker time (2.80s of 3.00s) is spent blocked on an outbound HTTP call, not doing any work of your own. That time counts fully against this ceiling while using no CPU at all — which is why the server can look idle at the exact moment the site stops responding.
Heat reports the walls ranked, not just the binding one, because the second entry is what makes the first actionable — a database that gives out three percent behind the worker pool is a reason not to spend the weekend resizing the pool.
It reads the machine you actually run
And it never presents something it inferred as something it measured.
The FPM pool
pm.max_children read from the pool configuration, across the layouts Debian, RHEL, Alpine, Homebrew and Bitnami each settled on — and Apache’s MaxRequestWorkers. It prefers the pool belonging to the PHP that is running, because a box with several versions installed will otherwise hand you the worker count of an interpreter that has not executed anything in years.
cgroup limits first
A container reporting 32 cores through /proc/cpuinfo may have a quota of two. Size a worker pool off the first number and the container gets throttled into the ground with every dashboard showing idle CPU. Heat checks the cgroup — v2 and v1 — before it believes the host.
Craft’s own settings
The configuration that changes capacity before any hardware does: devMode left on, template caching off, a per-machine cache that will not survive a second web server, transforms generated in-request — and the one nobody expects, below.
The queue is traffic
With Craft’s default runQueueAutomatically, the queue is not a background process at all — it is HTTP requests to your own site, taking workers from the same pool as the visitors. A resave of fifty thousand entries competes directly with traffic, and the site becomes unreachable on a box whose CPU graph looks bored.
Read, inferred, or guessed
Every value carries how it was obtained. A confidently stated worker count that was really a guess is the single most common way a capacity prediction goes wrong — so Heat says which numbers it read, and asks to be told the ones it could not.
Model production from a laptop
Override any of it — workers, cores, memory, connection limit, query parallelism — and a stated number is treated as fact rather than inference, because somebody who knows their own server configuration is a better source than any probe.
Getting Started
Install it, measure once, and read the answer.
composer require justinholtweb/craft-heat
php craft plugin/install heatThen, over SSH on the box you actually care about
# a few dozen sequential requests — safe on production
php craft heat/measure

# what this machine can take, and what gives out first
php craft heat/capacityPlanning for something specific
# the campaign lands and the cache is cold
php craft heat/capacity --mix=launch

# what would a bigger box actually buy?
php craft heat/capacity --workers=64 --cores=16

# what Heat could read here, and what it had to guess
php craft heat/capacity/machineOr do all of it in the control panel
Heat adds an Overview screen with the ceiling, the ladder and the advice, a Measure button that runs the pass in the queue, and Runs — each one kept together with the machine and the assumptions it was taken against, and replayed from those rather than from today’s.
Pricing
Lite is free and genuinely useful — it is the half that lets you decide whether to trust the paid half. Pro is a one-off licence with an optional renewal for updates.
Lite
Free
- ✓ The full capacity model and ranked walls
- ✓ The remediation advice, in full
- ✓ Machine probes and overrides
- ✓ Measurement pass — visitor and logged-in load
- ✓ All four preset traffic mixes
- ✓ Every console command
- ✓ The latest projection kept
Pro
$129
one-off · $99/year for updates
- ✓ Everything in Lite
- ✓ Editor load — concurrent entry saves, measured for real
- ✓ Queue load, and what it takes from your visitors
- ✓ Run history, kept with the machine it was taken on
- ✓ Compare two projections — before a release and after
- ✓ Custom scenarios and workload mixes (coming)
- ✓ Scheduled projections and regression alerts (coming)
If a Pro licence lapses, Heat downgrades rather than breaks: your stored runs and measured costs are left untouched and the plugin keeps working with the Lite feature set, so renewing restores exactly what was there. And Lite says plainly that its ceiling excludes editor and queue load, rather than quietly reporting a higher number.
Questions
Find Out Before Your Visitors Do
Free Lite edition, or $129 for the load your team puts on the site too.
Craft CMS 5.3+ · PHP 8.2+ · no runtime dependencies